My last post described the anchor chart as a learning tool in classrooms across our school. I highlighted snapshots I took based on our reading instruction. I thought you might also like a glimpse into our anchor charts in mathematics.
Some math anchors are displayed to help students conceptually understand and remember mathematical vocabulary.


Others remind students to think about their noticings or connections as they pertain to specific lessons including math games.


Anchor charts also highlight foundational learning like finding combinations of numbers. A students ability to decompose a number is critical for developing number sense and flexibility when solving problems. Many mental math strategies come back to a student's ability to decompose numbers efficiently. In addition to combinations, students also work with doubles and near doubles as they build number sense. Often times, you will find charts like these hanging in our primary classrooms.


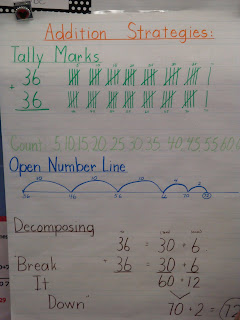
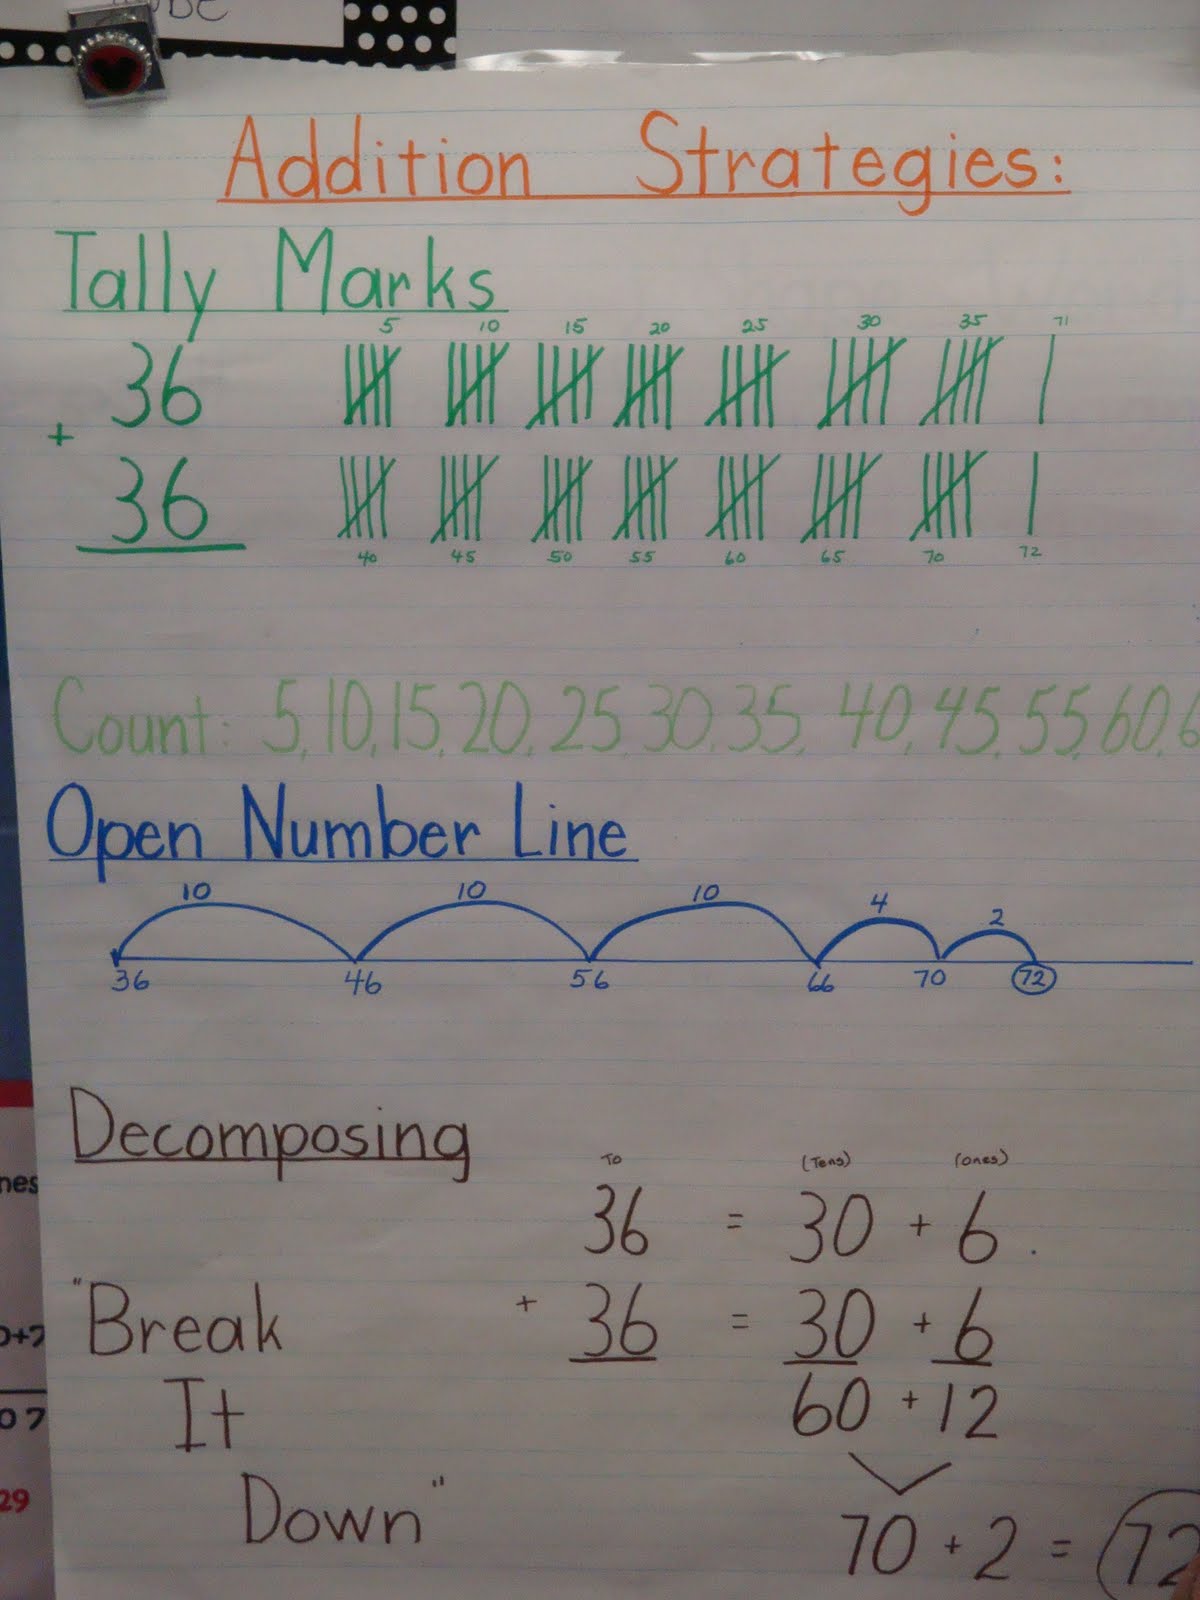
Furthermore, strategy charts play a prominent role. They are not charts that are premade and hung before instruction, rather are anchors built with students as new strategies emerge. Some charts show single strategies while others display many strategies.
Often times, when the chart lists more than one strategy, the strategies are listed by order of efficiency. The visual reminder helps students as they move along their learning pathway. In this case, a student's work may also become an anchor chart on the classroom wall as a reminder of a particular strategy that has been highlighted in a classroom math discussion.


 We use Math Investigations as our 60 minute Math Workshop curriculum tool. Like many conceptually based programs, MI embeds story problems into many of their math lessons. Therefore, it is common for teachers to have anchor charts which guide a student through solving a problem. Sometimes the anchors are found on a student's desk, some are in their math journals, and others hang on the classroom walls.

Still other math anchors assist in building student knowledge throughout units of study or remind students of necessary skills like multiplication and division notations.


 Regardless of their content, all math anchor charts have the same intent-to be a visual reminder to students of the thinking that has taken place and to act as a springboard for further learning. Classrooms displaying rich math anchor charts offer students the environment they need to become effective mathematicians.


